Welcome to our simple Google Analytics 4 tutorial and training guide! But first make sure you have a better understanding of the next generation of Analytics and know some of the differences between Google Analytics 4 (GA4) properties and Universal Analytics (UA) properties before immediately upgrading.
Our Google Analytics 4 tutorial and training guide will help you quickly learn:
- The differences between UA and GA4 reporting and analysis.
- Navigating through the GA4 reporting interface.
- The powerful techniques available in the new Analysis tool.
- How to utilize the search tool to find exactly what you need.
The Future of Reporting & Analysis is Here!
Google Analytics and the way it collects, and processes data is 12 years old. It was way past time for Google to innovate their analytical platform and provide their users with a solution for a future without cookies and user identifiers. The GA4 property was designed to deliver actionable insights into both your website and mobile app by helping you explore your data at the level you need. With the assistance of machine learning, you will have the ability to conduct a technical analysis much quicker and provide an even higher-level of reporting.
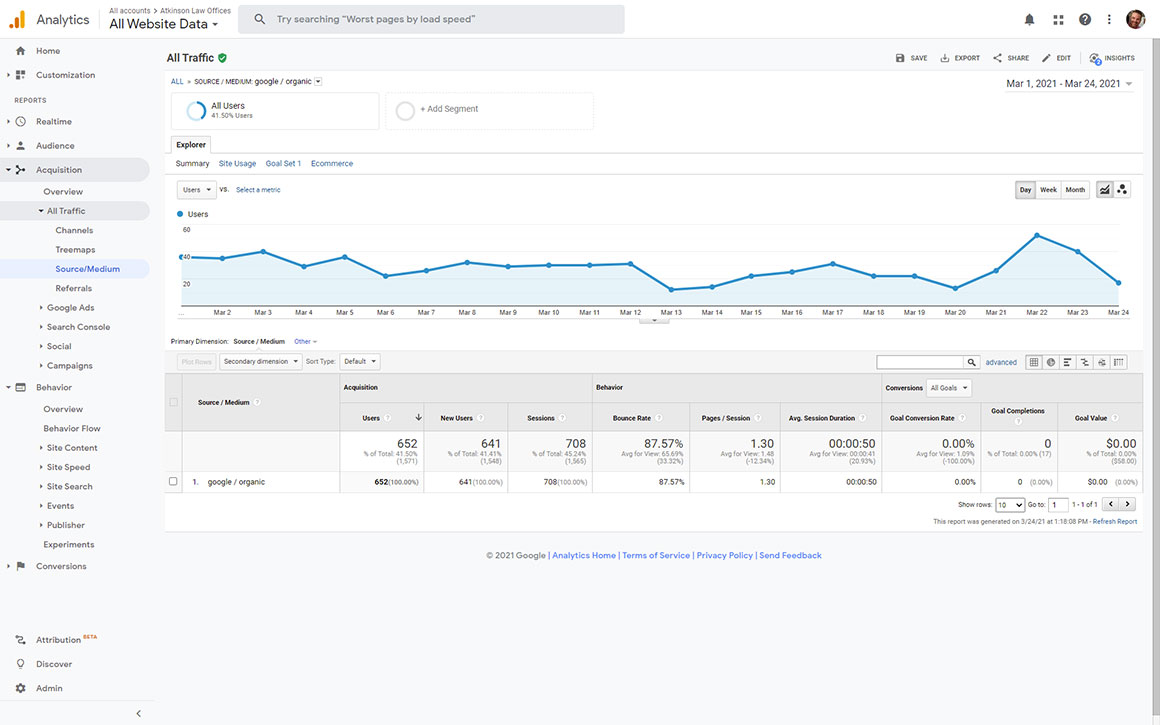
Reporting & Analysis in Universal Analytics Properties
Universal Analytics properties organize your data into predefined reports. In time, the number of predefined reports simply grew to cover each use case. You can customize reports to your liking, but it does not really change the way the data is collected and processed. What we are left with is dozens of reports based on user sessions, and if one customer uses multiple platforms or devices to visit your website, they show as multiple users in your reports:
Reporting & Analysis in Google Analytics 4 Properties
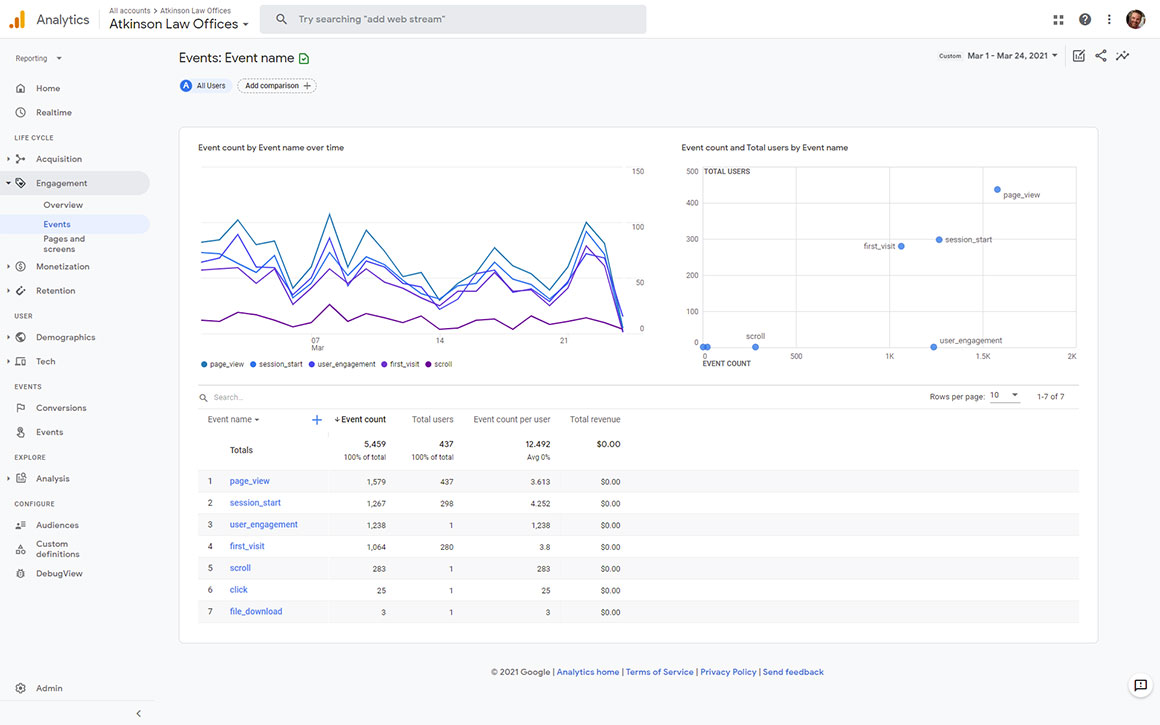
Google Analytics 4 properties simplify the reporting by providing just a handful of overview reports. Each overview report shows a single insight about your business in a summary card, like “What events are your users completing?” You can analyze an overview of many different engagements such as events, as well as pages and screens.
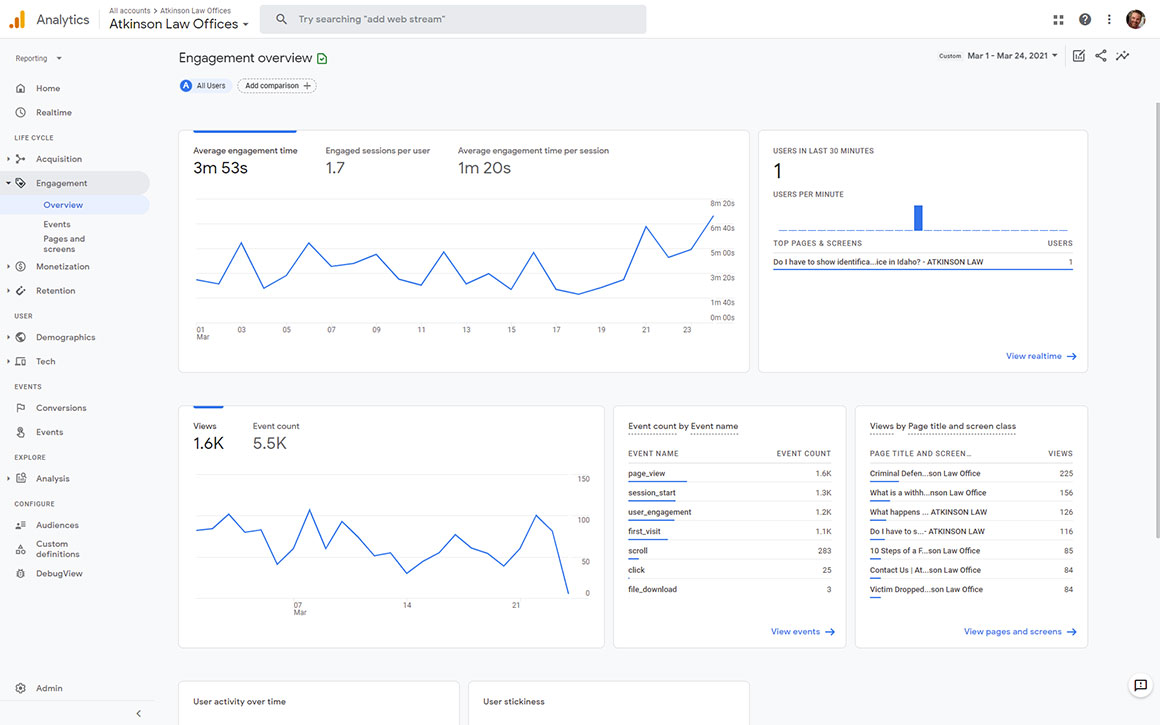
Would you like to taste even more delicious insights? You can find a more comprehensive report by clicking the link at the bottom of each summary card. By clicking “View events ->” you are taken to a drill down of the events such as page views, first time visitors, scrolls, clicks, and file downloads.
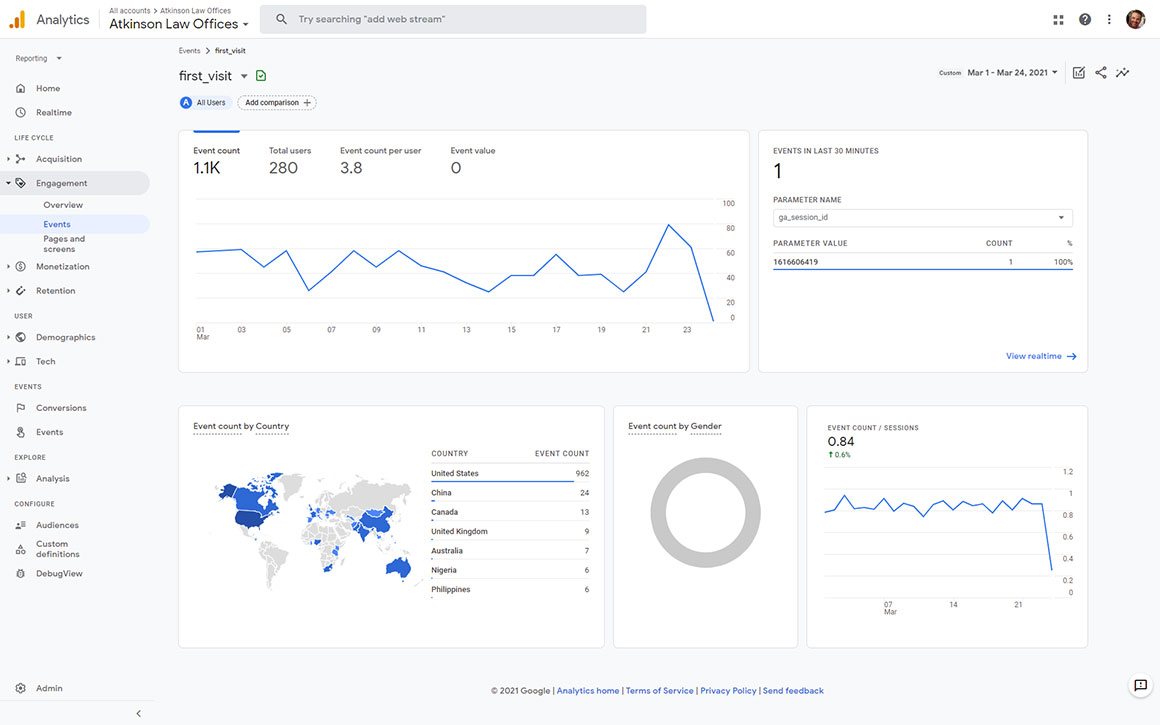
If you would like to analyze a particular event, simply click it. Want to know more about people first time visitors to your website? It is just a click away:
The Realtime Report
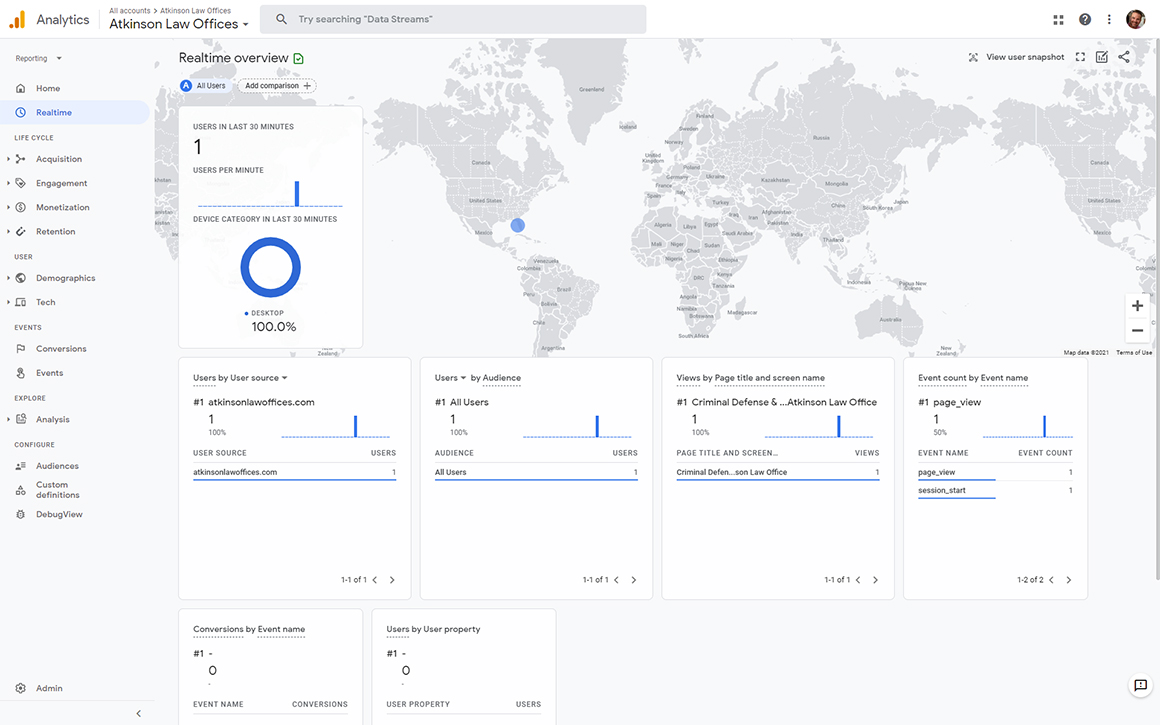
Want to monitor the activity on your website as it happens? The Realtime report shows events that occurring between 5-seconds and 30-minutes ago. It has a card-based layout that is designed to answer important questions about the interaction with your business faster. Each card represents a stage in your marketing funnel, and with this report you can:
- Review different segments of visitors for real-time performance comparisons.
- Create a new segment easily and use it in other reports.
Explore Your Data with Analysis
The Analysis feature in GA4 properties delivers more customizable ways to explore your data. The Analysis tool offers a simpler way to filter, sort, segment, and refactor your data with its new drag and drop feature. Just like with the new reporting, it also utilizes machine learning to make your data more meaningful, accessible, and actionable. Quickly zero in on the information you care most about and export the most interesting data sets you discover as Google Analytics segments or audiences. Is your business utilizing Google Ads? You can export audiences to remarket your brand, service, or product with relative ads.
Powerful Techniques to Utilize with Analysis
The Analysis tool helps you easily configure and switch between a ton of powerful techniques that include:
- Exploration
- Funnel Analysis
- Path Analysis
- Segment Overlap
- User Explorer
- Cohort Analysis
- User Lifetime
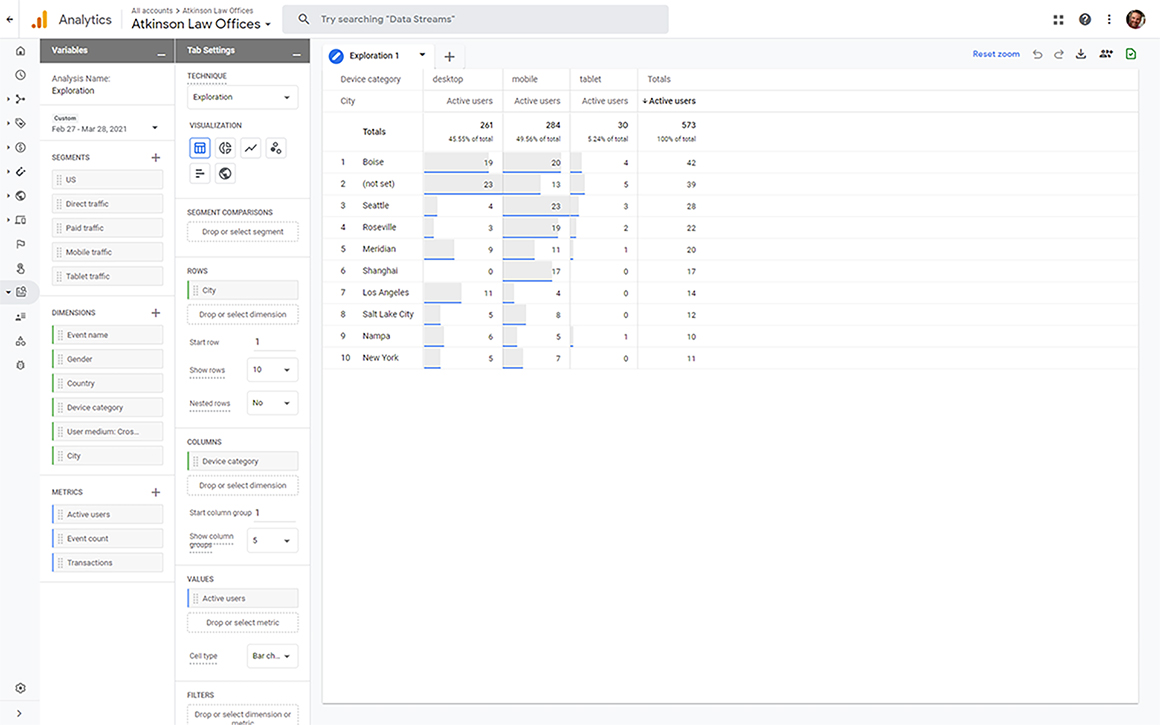
Exploration
Exploration is where you can easily visualize your data in a table or graph. Choose the variables you are interested in then drag and drop them onto a canvas to see instant visualizations. Unable to find a variable you need? Click the plus icon to view the full list of dimensions and metrics available. You can also apply different visualization styles including bar graphs, pie and line charts, scatter plots, and maps. If you see something significant, right-click on that data point to easily create a segment or audience to use in other analyses. For instance, if line charts are your thing you will see an automatic feature enabled called “anomaly detection” which utilizes machine learning to identify outliers in your data according to your parameters.
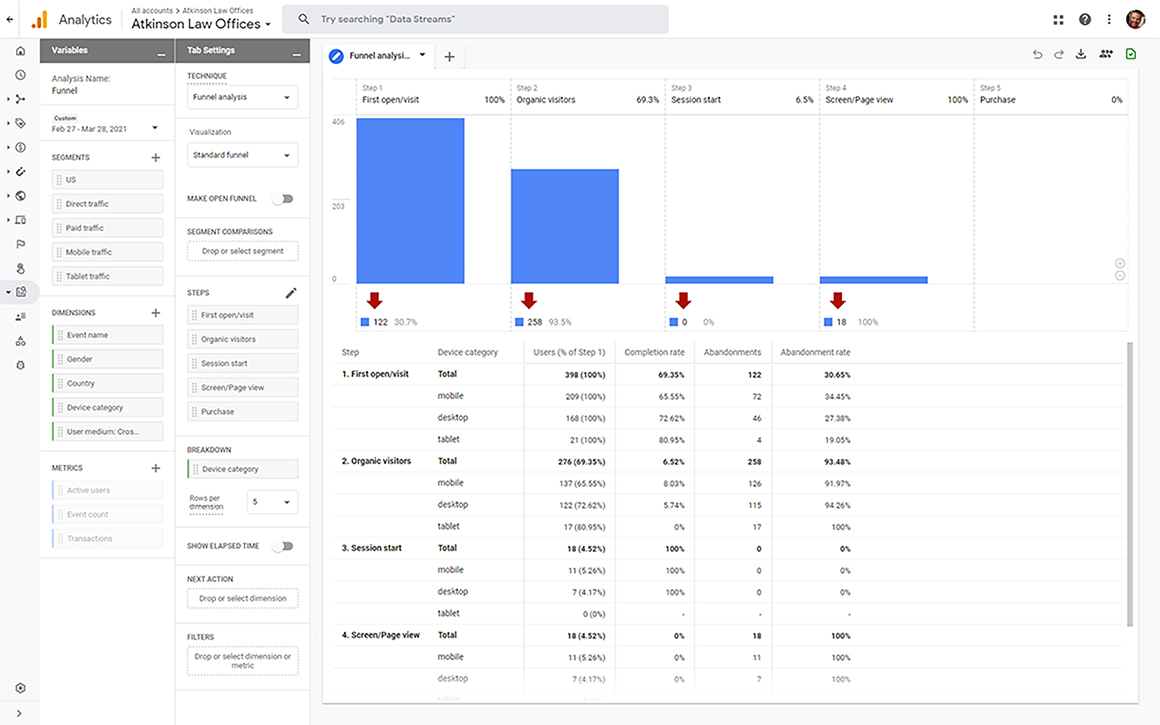
Funnel Analysis
Funnel analysis allows you to visualize the steps your visitors take to complete an action and immediately view how well they are succeeding or failing at each step. See where visitors enter your marketing or sales funnels as well as where they fall off. It will help you identify patterns within key events and understand how your users navigate through these steps. Wondering why customers are abandoning their shopping cart and want to remarket to them so they complete their purchase? Utilize this tool to simply create audiences of visitors based on where they enter or leave the funnels you define. GA4 properties provide the ability to define up to 10 steps in your funnels while UA only provides five. You can now analyze both closed and open funnels where your customers either enter at the beginning or any point of the funnel.
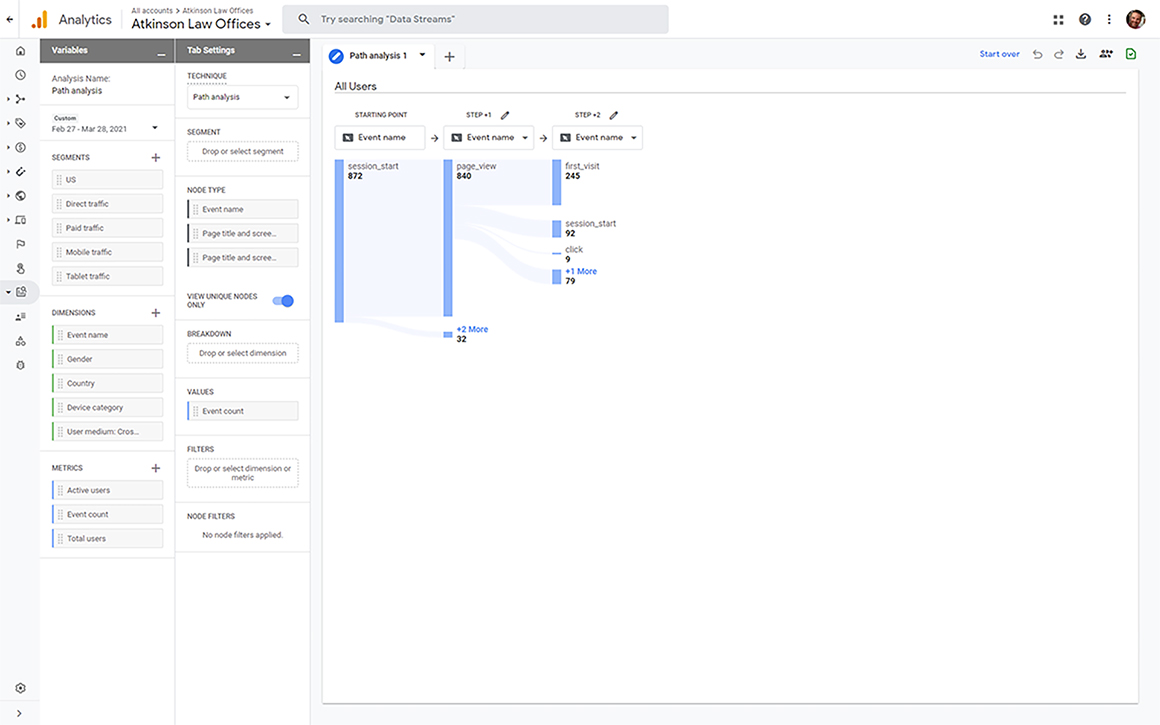
Path Analysis
Want to know how customers progress through from one stage in their journey to the next? Path analysis is like funnel analysis as it allows you to visually see the steps users take through your website or mobile app. It is a way to analyze a free-flowing path as opposed to a predefined funnel where you can follow any number of undefined paths a user takes. You will be able to discover things like looping behavior where users are stuck within your site or app. If you do define a path with start and end points, path analysis helps you understand how users reached a certain step in their journey, and what they did afterwards.
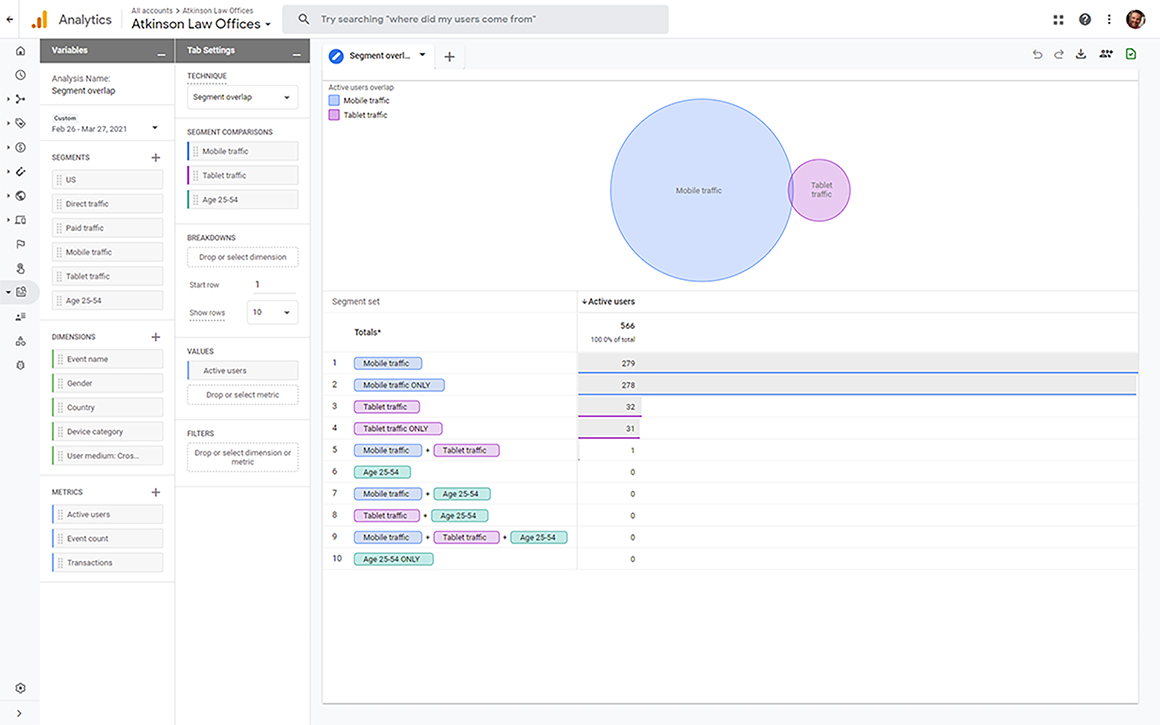
Segment Overlap
Compare up to three (3) user segments with the segment overlap technique to see how those segments relate to each other. You will be able to isolate individual audiences based on complex conditions. Based on what you discover, you can use that information to create new segments to apply to other Analysis techniques and Google Analytics reports.
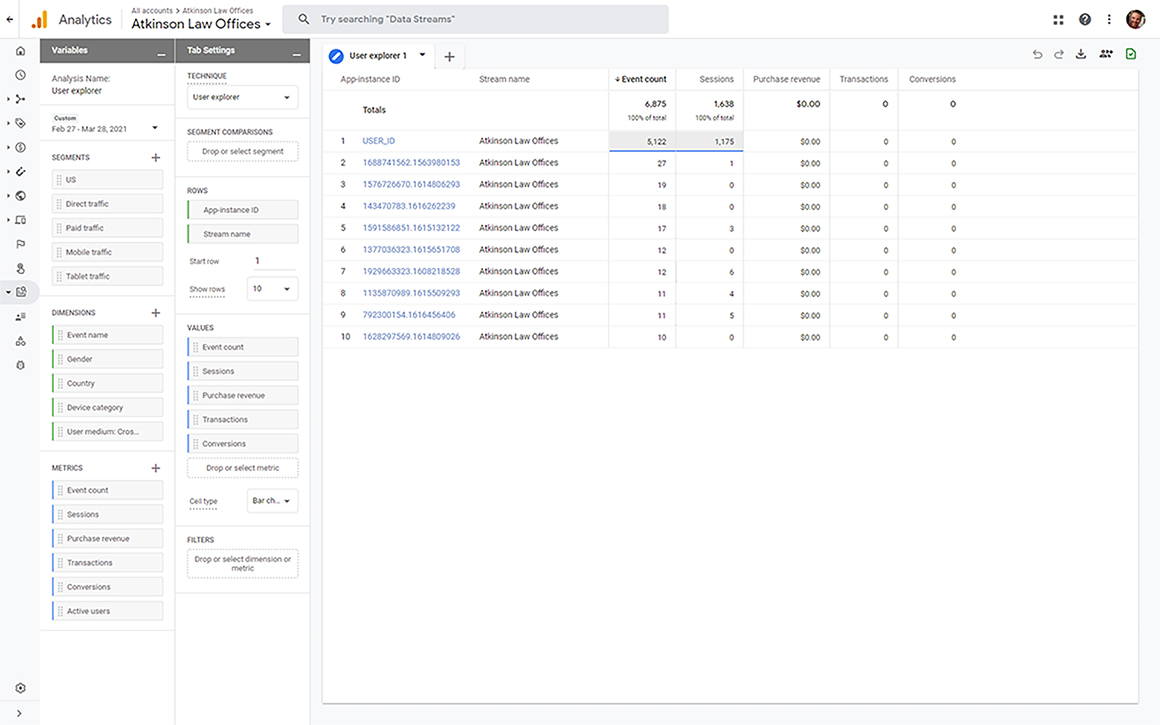
User Explorer
The User Explorer technique allows you to choose specific groups of users to learn more about individual user’s activities. Group users like ones that visited your website and downloaded your app to help you understand their behavior and personalize their experience to improve conversions.
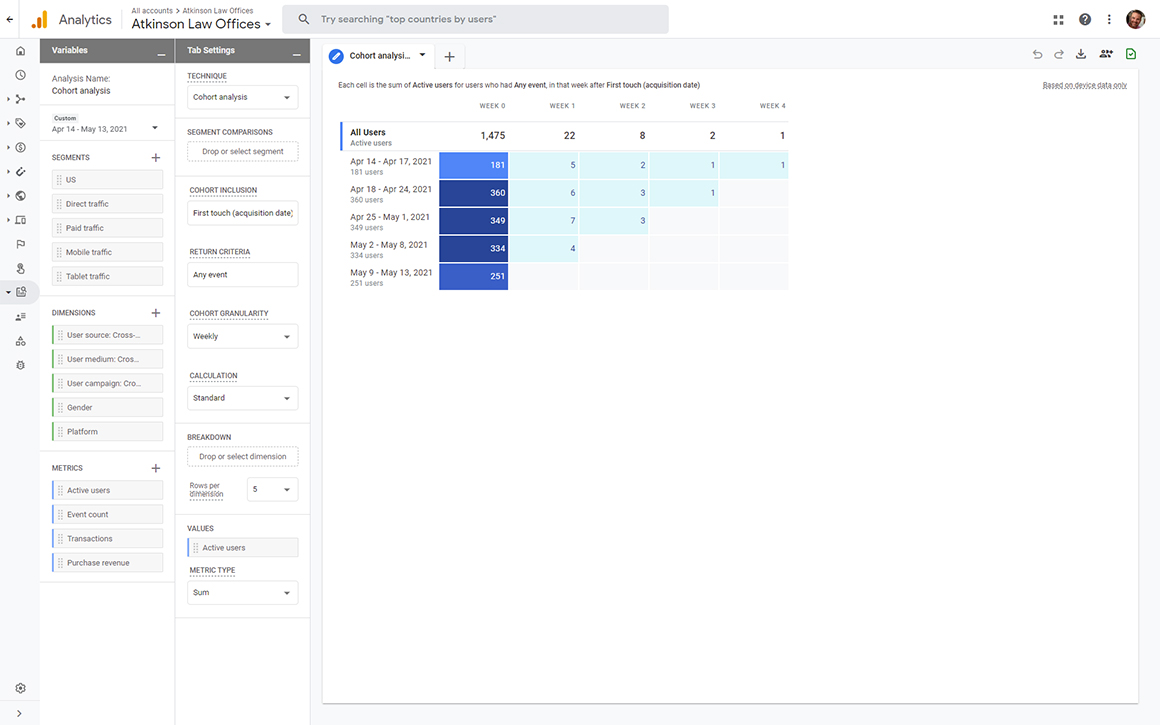
Cohort Analysis
The cohort analysis is a report that shows a group of users who share a common characteristic. For instance, you will be able to explore the behavior of a group of users over time that signed up for your newsletter within the same week. It starts by finding the users who satisfy the selected inclusion and return criteria. You can create cohorts based on your customer’s acquisition date, an event they triggered, their conversions or transactions.
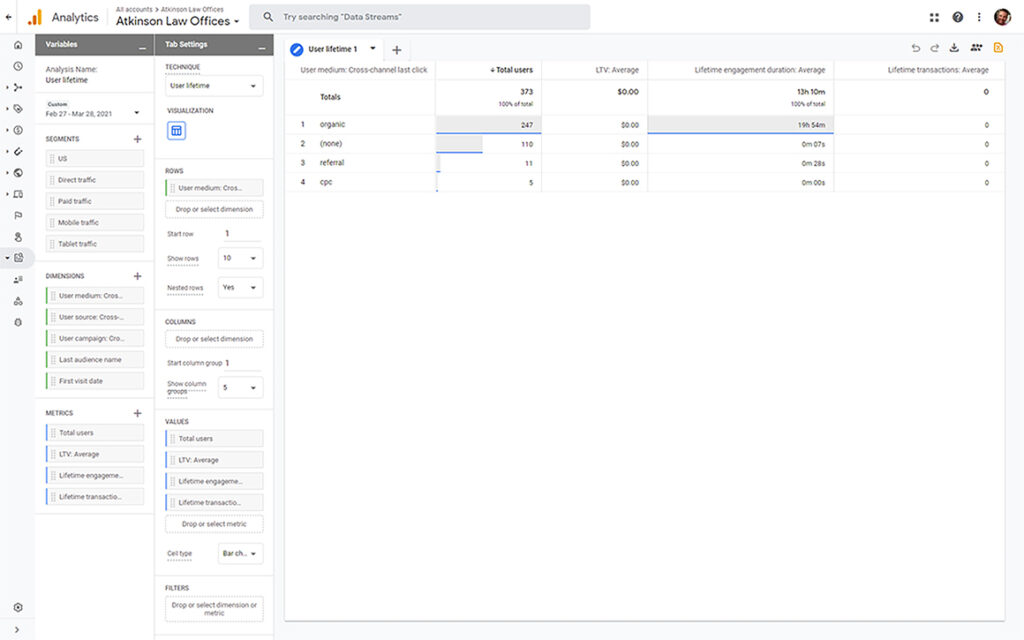
User Lifetime
A successful business does what? They decrease the cost per customer acquisition while they increase the lifetime value of their customer. The GA4 property allows you to analyze user behavior and value over their lifetime as a customer of your website or mobile app. You will discover specific insights such as which campaign/source/medium drove users with the highest lifetime revenue. With the help of machine learning, Google Analytics predictions models help calculate which active campaigns are acquiring users who are expected to be more valuable, with higher purchase probability and lower churn probability.
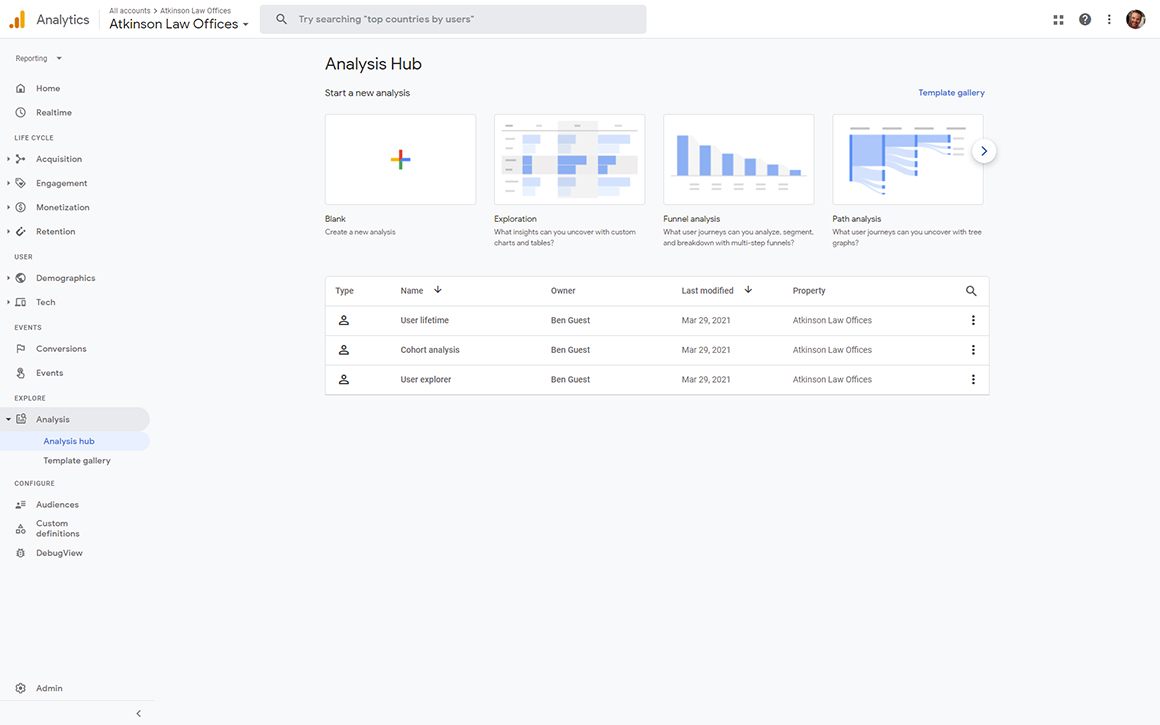
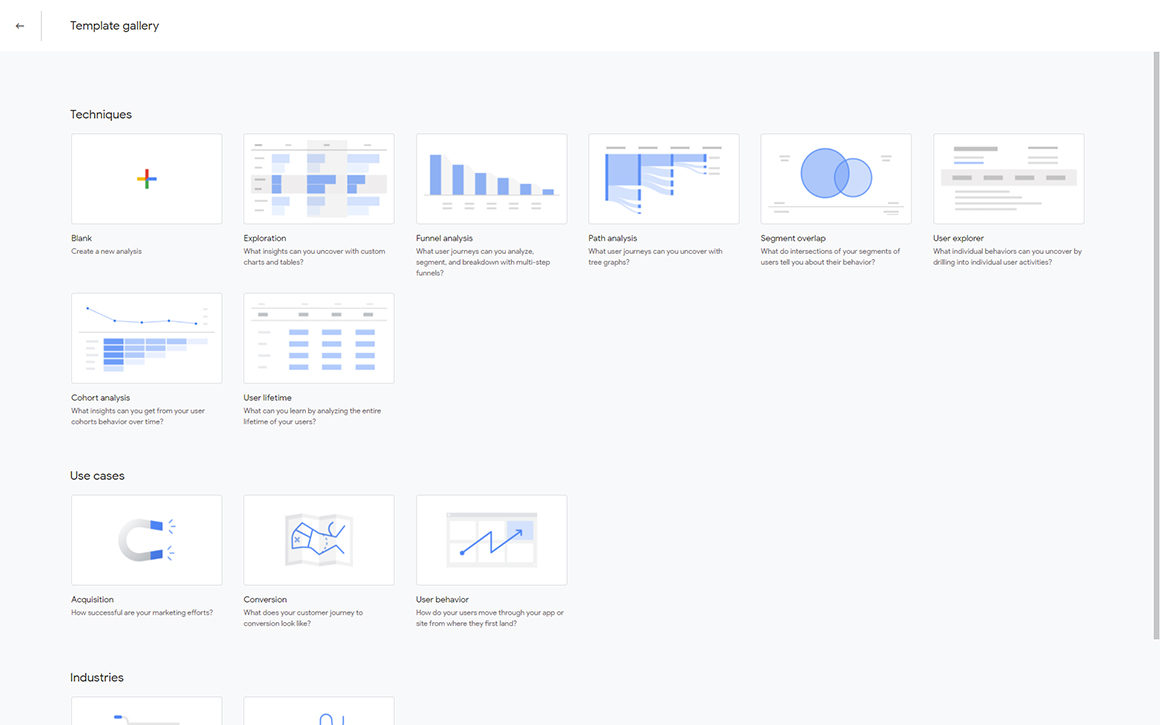
All these delicious goodies are found in the Analysis hub. It shows previously created analyses and templates for new ones. You can customize new ones from the techniques outlines above or from scratch by starting with a blank canvas. You can also find templates shared with you from others.
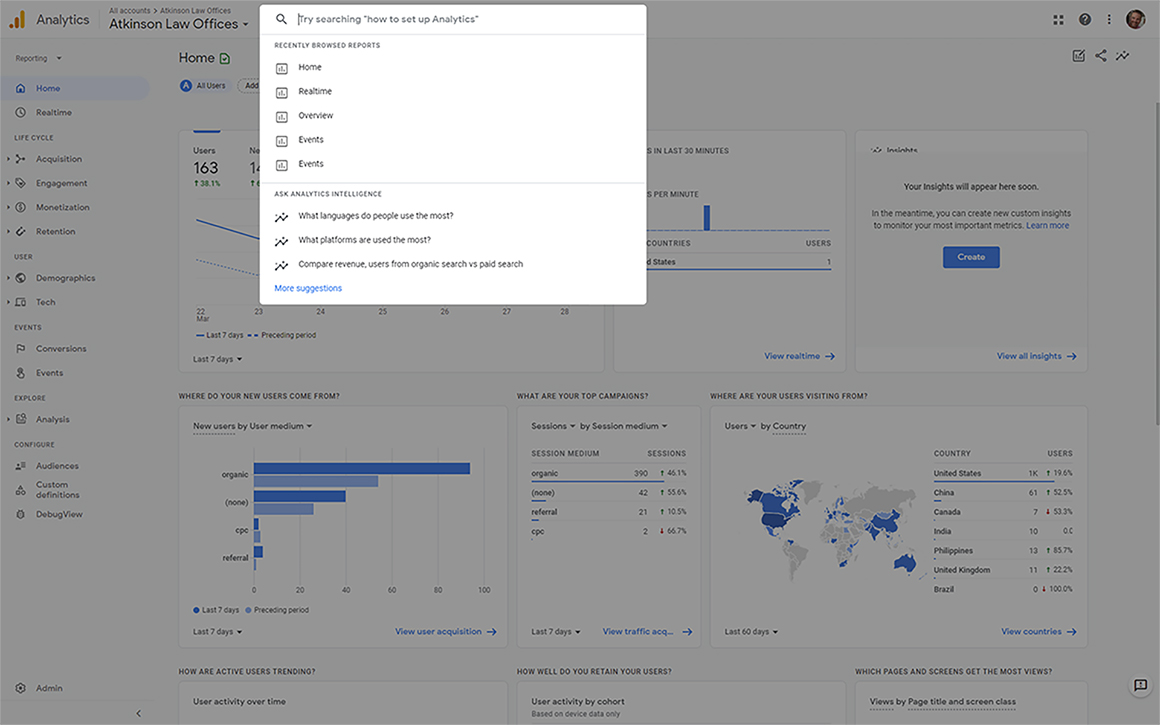
Can’t Find It? Try the Search Tool.
If you need to quickly find a specific report or insight, use the search box at the top. As soon as you click it, you will see recent searches as well as reports you recently opened. Believe it or not, you can ask it a wide range of questions about your Analytics data. Just be specific about the dimension, metric, and time frame to receive the preferred response. You can also use the search tool to ask for help with Analytics.
Create Your Own Google Analytics 4 Property
Now that you know what you are in for, we will show you how to set up a Google Analytics 4 property.
Step 1 – Create a new or open an existing account.
Follow this link to create a new or sign-in to your existing Google Analytics account.
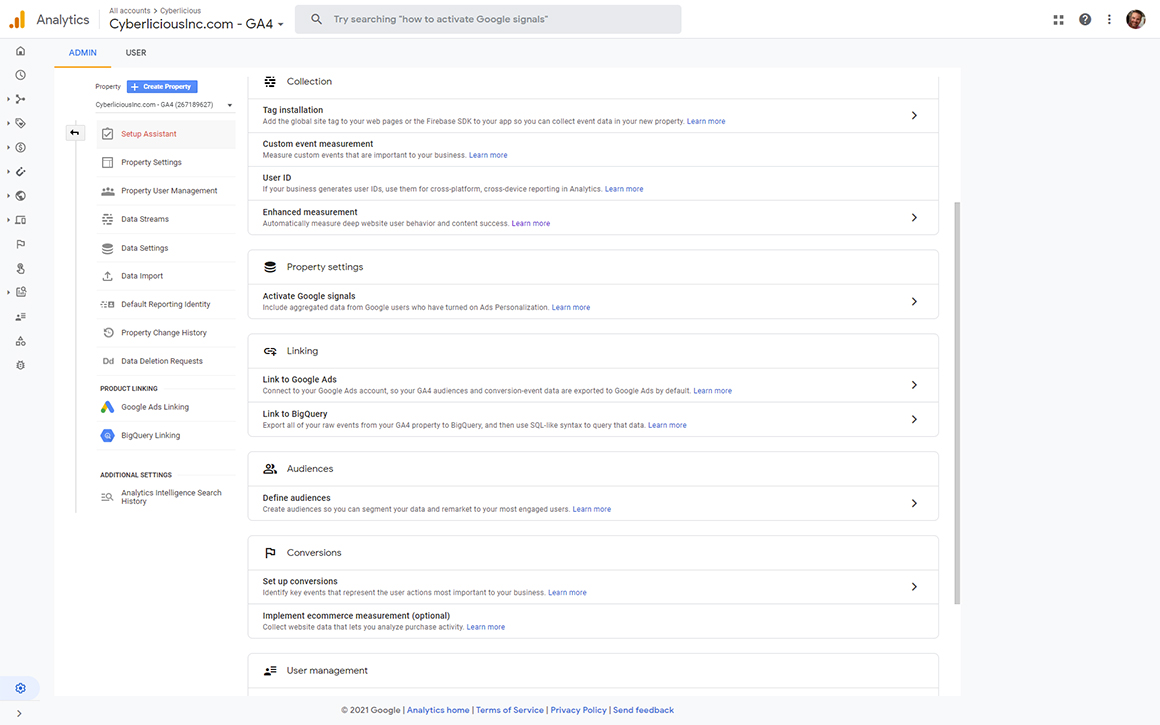
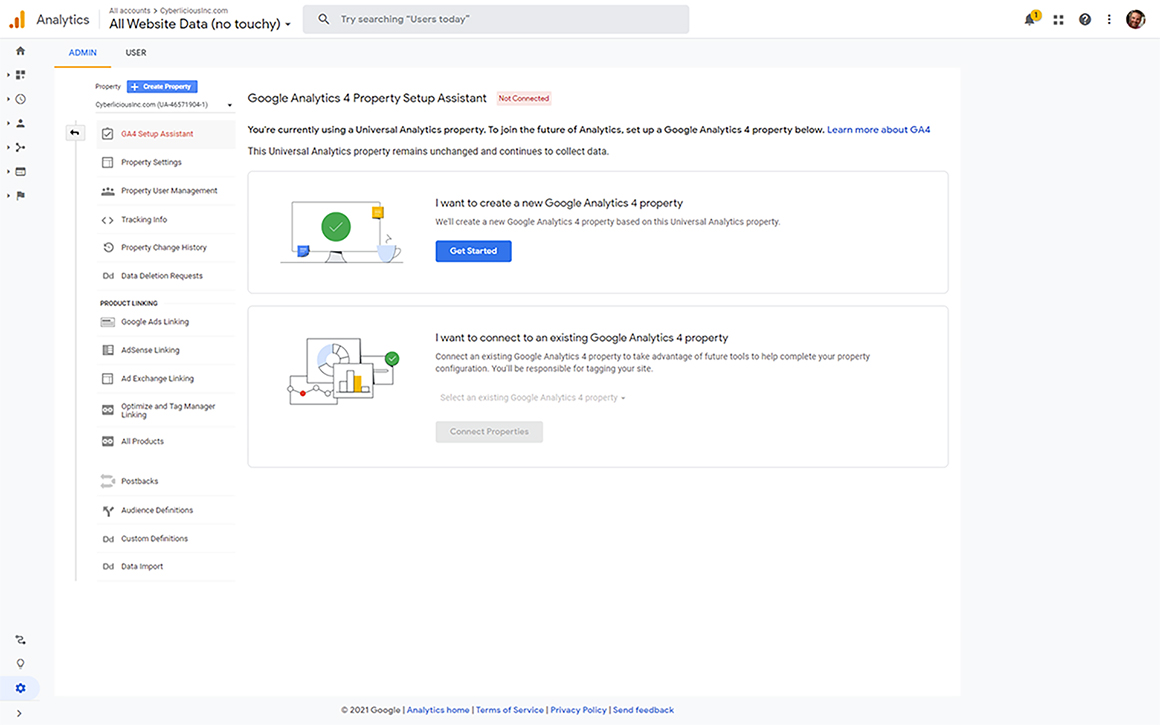
Step 2 – Create a GA4 property.
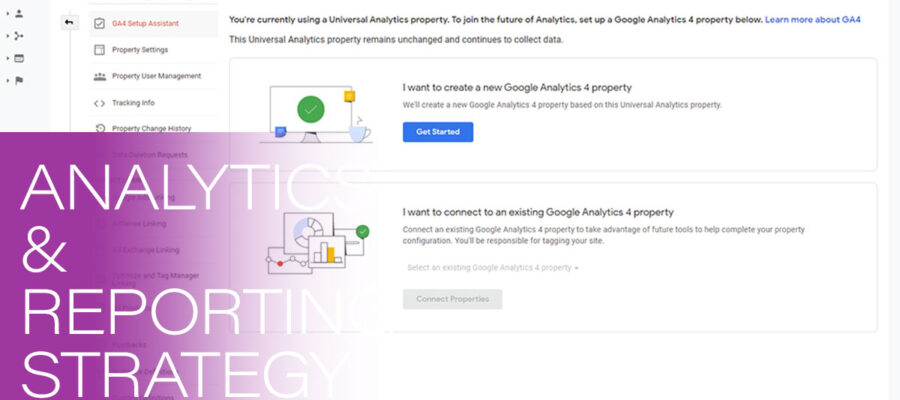
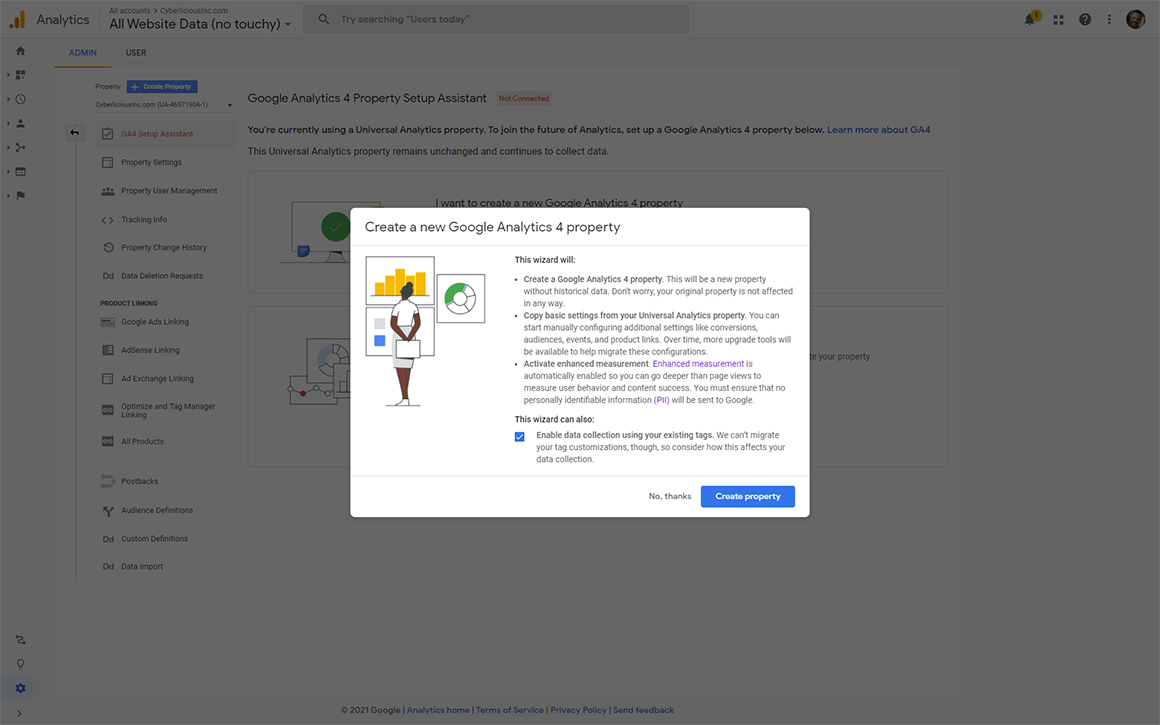
If this is a new Google Analytics account, the GA4 properties are created by default. If this is an existing account utilizing Universal Analytics (UA) properties go to Admin>Property>GA4 Setup Assistant to get started. Remember, this creates a new property while the UA properties remain unchanged. Simply click the Get Started button to start the wizard:
Decide if you would like to disable data collection using your existing tags. If you have any tag customizations, you will have to consider how this setting affects your data.
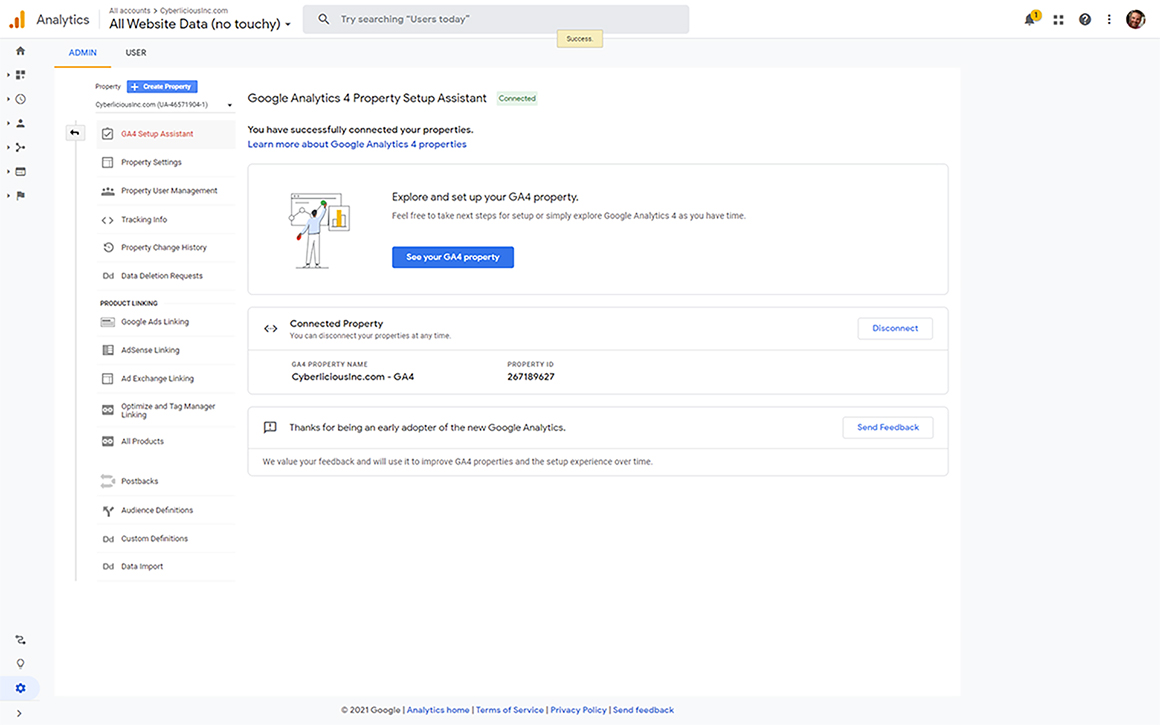
You now have a GA 4 property created within the same Google Analytics account.
Step 3 – Create a data stream.
If this is an existing account, the web data stream is automatically created. If this is a new account, you will have to add your data streams. Choose iOS, Android, or web then enter the information for your website or mobile app.
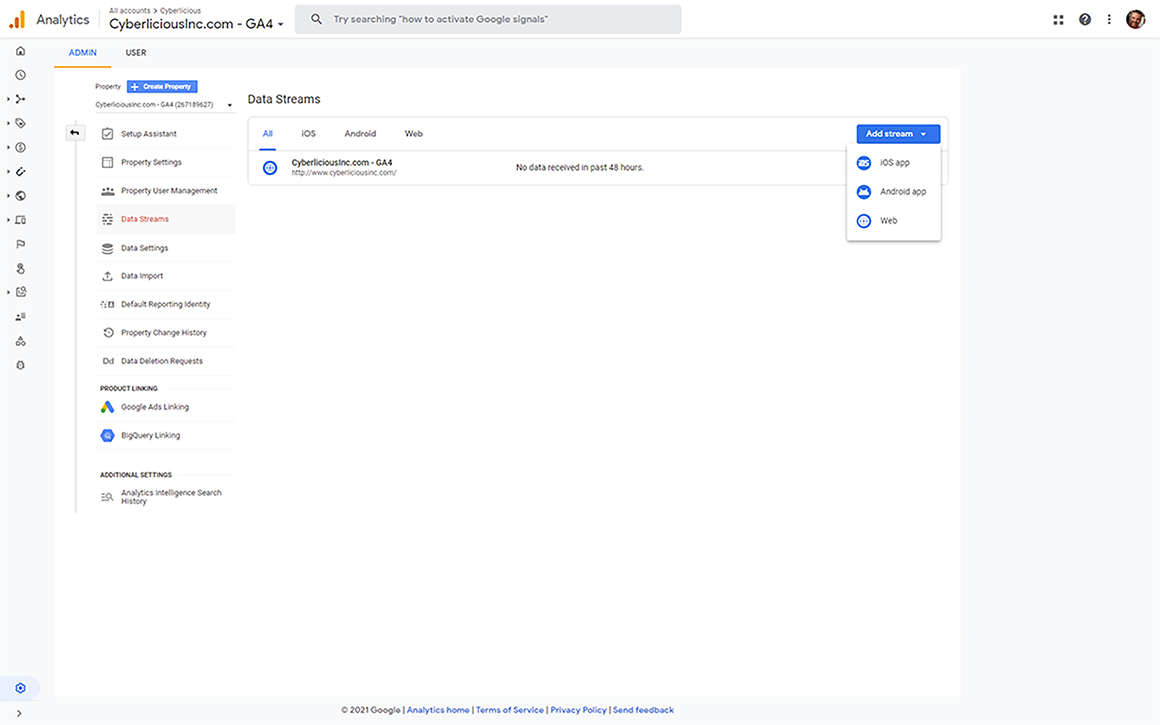
If you are creating a web data stream you will see an option called “enhanced measurement.” Leave this turned on if you want to automatically collect pageviews, outbound link clicks, scrolling, and other common user events.
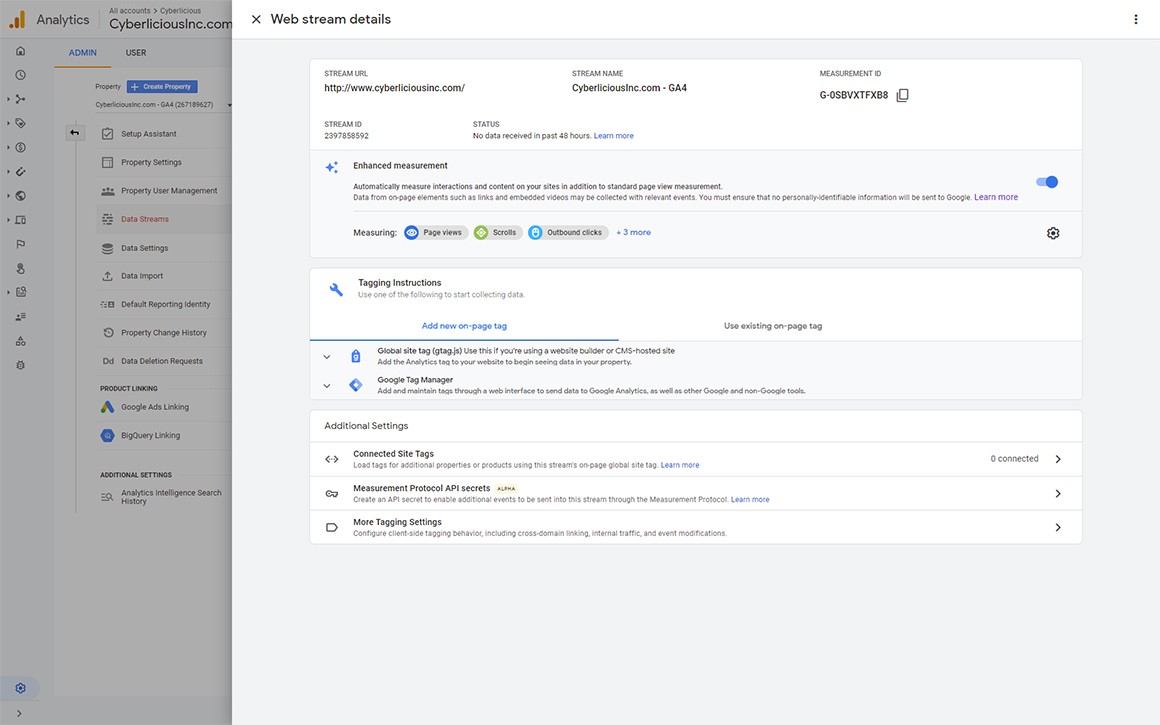
Step 4 – Enable data collection.
For web, follow the steps in the guides to make sure your website contains the appropriate tags.
For app, follow the steps outlined in this guide.
Happy data collecting!
You now have data collecting in your new GA4 property. Remember, this is only the beginning as new features are added periodically. Make sure to always check your settings to ensure you are not missing out on important insights that improve your business’s intelligence.